🚀 30-Day Money-Back Guarantee · 📦 Free Delivery · 🛡️ 2-Year Warranty


Sprint vs. Witty. Comparison
5/4/20264 min read
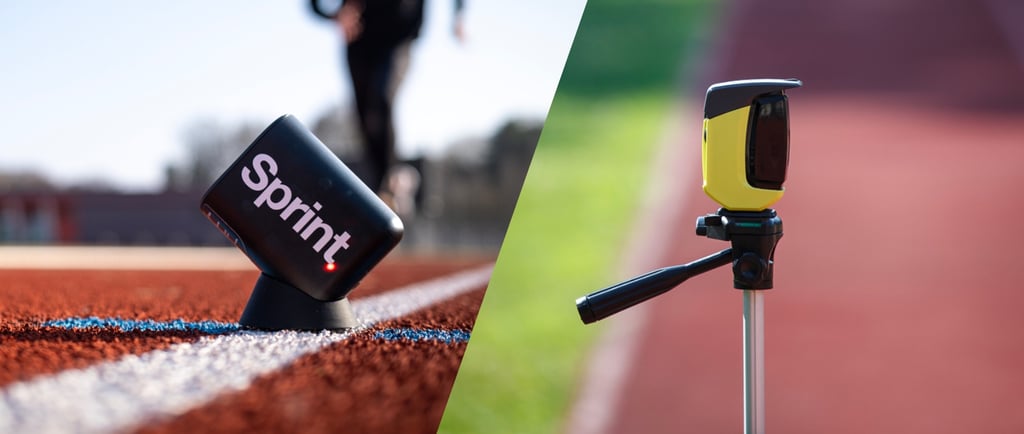
This report presents a systematic analysis comparing the newly developed time measurement system 'Sprint' with the reliable 'Witty' system. Data were collected using a 20-meter sprint test from a stationary start, where the starting line was positioned 70 cm before the first gate. The aim is to evaluate the accuracy of the Sprint system and its suitability as a replacement for Witty gates in sports contexts.
Test Description
– Number of participants: 89
– Age group: 9–10 years
– Test type: 20-meter sprint from a stationary start
– Starting position: 70 cm before the first gates
– Number of measurements: 1 Sprint and 1 Witty per participant (simultaneously)
– Equipment used: Sprint (new system), Microgate Witty (reference system)
Methodology
The following statistical methods were applied based on one Sprint and one Witty measurement per subject:
– Pearson correlation (r): strength of the relationship between the results of both systems.
– Systematic bias: average difference between Sprint and Witty measurements.
– SEE (Standard Error of Estimate): error level when predicting one system’s results based on the other.
– Bland–Altman analysis: visualization of differences between systems and determination of error boundaries.
– Paired t-test: significance of the difference between the results of the two systems.
Statistical Summary
Indicator
Pearson correlation (r)
P value
Systematic bias (Sprint - Witty)
Standard deviation of differences
Upper agreement limit
Lower agreement limit
Standard Error of Estimate (SEE)
Value
0.985 ¹
<0.001 ²
-0.002 ³
0.066 ⁴
0.127 ⁵
-0.131 ⁵
0.065 ⁶
Paired T-test Results
Mean difference (Sprint - Witty)
t value
p value
95% confidence interval (lower)
95% confidence interval (upper)
-0.002 ¹
-0.342
0.733 ²
-0.016 ³
0.011 ³
Visualisations
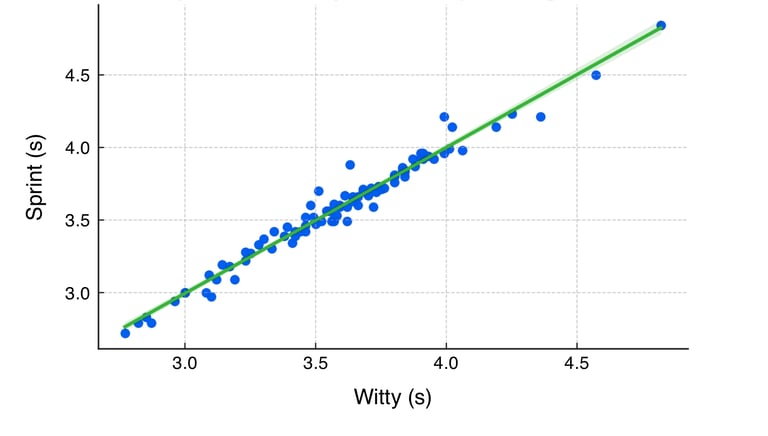
Correlation chart between the results of the Sprint and Witty systems:
Conclusion
The ultrasonic Sprint system is characterized by low cost, compact design, and the potential for use across broad populations. The aim of this study was to evaluate the reliability and measurement accuracy of the Sprint system in comparison with the validated Witty system, which is widely used in sports research. The study included 89 children (mean age 11.7 ± 2.2 years, height 161.6 ± 16.2 cm, weight 50.0 ± 14.5 kg). The Sprint system (Motion Trials, Lithuania) and the Witty gates (Microgate, Italy) were used simultaneously to measure 20-meter sprint times. Data analysis was conducted using Pearson correlation, the Bland-Altman method, and a paired T-test. The correlation between the results of the Sprint and Witty systems was very strong (r = 0.984, p < 0.001), the mean systematic bias was negligible (-0.002 s), and the standard deviation of the differences was 0.066 s. The average time measured by the Witty system was 3.540 ± 0.336 s, while the Sprint system recorded 3.538 ± 0.344 s. The paired T-test showed no statistically significant differences between the measurements (p > 0.05). The reliability and validity of the Sprint system in measuring sprint time meet sports science standards, as supported by other studies on innovative measurement systems. The Sprint system can be widely applied both in elite sports and general education institutions, facilitating the work of coaches and physical education teachers.

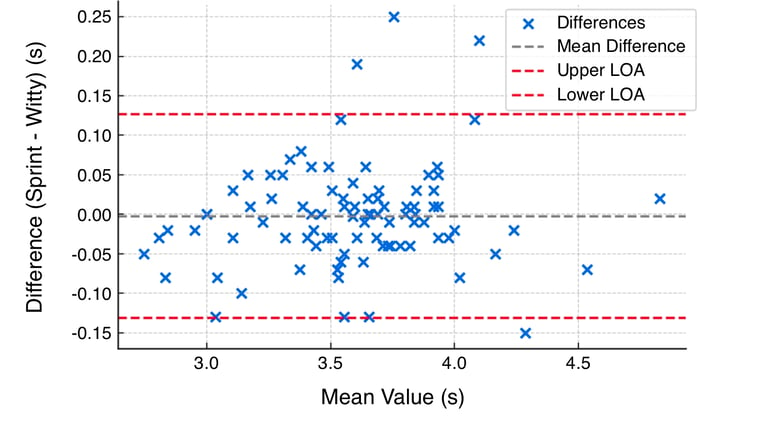
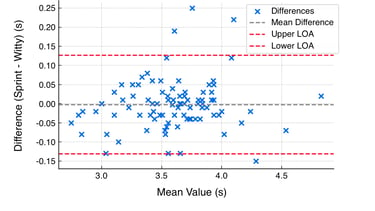
Bland–Altman analysis chart (distribution of measurement differences):
1. Pearson correlation ranges from -1 to 1. An "r" of 0.985 shows an extremely high positive correlation, meaning that as one device records a higher time, the other does as well, in a near-perfect linear fashion.
2. P < 0.001 is statistical shorthand for "the probability that this strong relationship happened by random chance is less than 0.1%". It means we can be very confident that the relationship between these two devices is real and not due to random luck in the measurements.
3. On average, the "Sprint" method was 0.002 seconds faster than the "Witty" system. For most practical athletic applications, a difference of just 2 milliseconds is negligible, meaning the devices are measuring almost identically on average.
4. On about 68% of the tests, the difference between the two devices was within ±0.066 seconds. This is a small value, suggesting that the differences between the two methods are consistent and predictable, not wild and random.
5. There is a 95% probability that any single "Sprint" measurement will be between 0.131 seconds faster and 0.127 seconds slower than the corresponding "Witty" measurement.
6. If you used "Witty" times to predict "Sprint" times, your prediction would be off by an average of ±0.065 seconds. It is low and consistent with the small standard deviation, confirming the data is highly consistent.
1. On average, the "Sprint" method was 0.002 seconds faster than the "Witty" system. For most practical athletic applications, a difference of just 2 milliseconds is negligible, meaning the devices are measuring almost identically on average.
2. There is a 73.3% probability that this small -0.002 second difference is purely due to random chance (measurement noise) and not a reflection of a real bias. It means you can confidently say the two devices give statistically identical times, with no evidence of systematic bias.
3. We are 95% confident that the true, average bias is between 0.016 seconds faster and 0.011 seconds slower. When a confidence interval for a difference includes zero, it is the mathematical reason why the T-test is non-significant. It visually confirms that a bias of exactly 0 is a plausible true value. This reinforces the finding that there is no meaningful systematic bias between the "Sprint" and "Witty" methods.
Independent research conducted by the Lithuanian Sports University

Designed and assembled in the EU.
© 2026, Motion Trials